Visualize dataset analysis
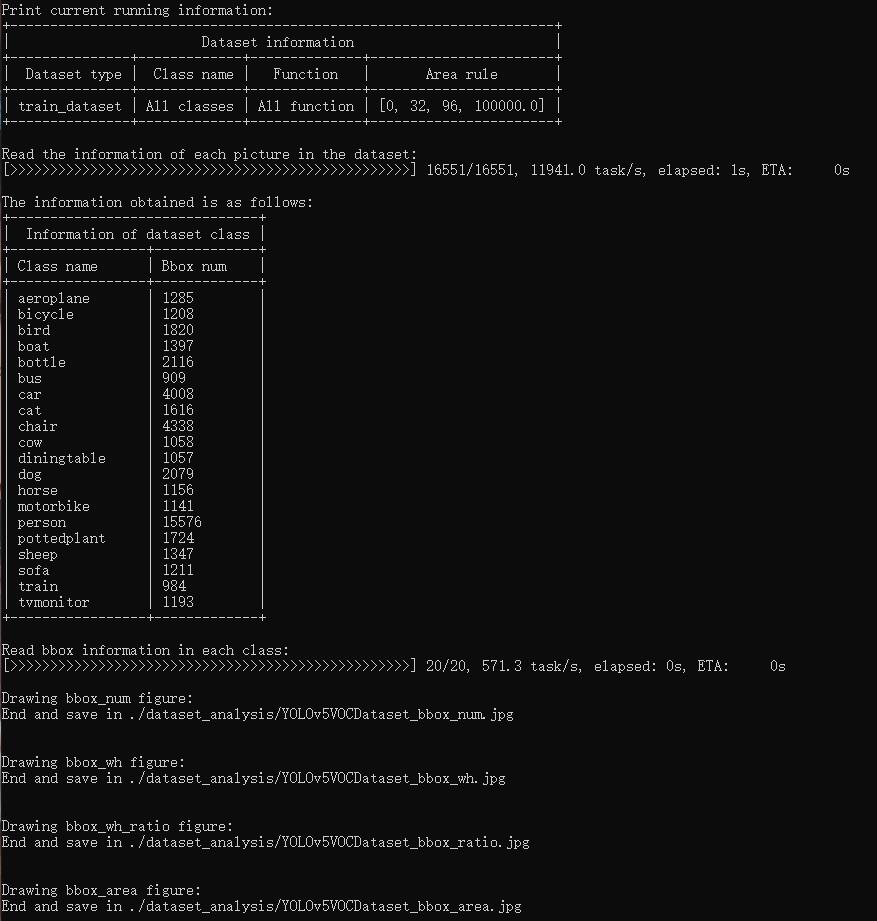
tools/analysis_tools/dataset_analysis.py help users get the renderings of the four functions, and save the pictures to the dataset_analysis folder under the current running directory.
Description of the script’s functions:
The data required by each sub function is obtained through the data preparation of main().
Function 1: Generated by the sub function show_bbox_num to display the distribution of categories and bbox instances.
Function 2: Generated by the sub function show_bbox_wh to display the width and height distribution of categories and bbox instances.
Function 3: Generated by the sub function show_bbox_wh_ratio to display the width to height ratio distribution of categories and bbox instances.
Function 3: Generated by the sub function show_bbox_area to display the distribution map of category and bbox instance area based on area rules.
Print List: Generated by the sub function show_class_list and show_data_list.
python tools/analysis_tools/dataset_analysis.py ${CONFIG} \
                                                [--type ${TYPE}] \
                                                [--class-name ${CLASS_NAME}] \
                                                [--area-rule ${AREA_RULE}] \
                                                [--func ${FUNC}] \
                                                [--out-dir ${OUT_DIR}]
E,g:
1.Use config file configs/yolov5/voc/yolov5_s-v61_fast_1xb64-50e_voc.py analyze the dataset, By default,the data loading type is train_dataset, the area rule is [0,32,96,1e5], generate a result graph containing all functions and save the graph to the current running directory ./dataset_analysis folder:
python tools/analysis_tools/dataset_analysis.py configs/yolov5/voc/yolov5_s-v61_fast_1xb64-50e_voc.py
2.Use config file configs/yolov5/voc/yolov5_s-v61_fast_1xb64-50e_voc.py analyze the dataset, change the data loading type from the default train_dataset to val_dataset through the --val-dataset setting:
python tools/analysis_tools/dataset_analysis.py configs/yolov5/voc/yolov5_s-v61_fast_1xb64-50e_voc.py \
                                                --val-dataset
3.Use config file configs/yolov5/voc/yolov5_s-v61_fast_1xb64-50e_voc.py analyze the dataset, change the display of all generated classes to specific classes. Take the display of person classes as an example:
python tools/analysis_tools/dataset_analysis.py configs/yolov5/voc/yolov5_s-v61_fast_1xb64-50e_voc.py \
                                                --class-name person
4.Use config file configs/yolov5/voc/yolov5_s-v61_fast_1xb64-50e_voc.py analyze the dataset, redefine the area rule through --area-rule . Take 30 70 125 as an example, the area rule becomes [0,30,70,125,1e5]:
python tools/analysis_tools/dataset_analysis.py configs/yolov5/voc/yolov5_s-v61_fast_1xb64-50e_voc.py \
                                                --area-rule 30 70 125
5.Use config file configs/yolov5/voc/yolov5_s-v61_fast_1xb64-50e_voc.py analyze the dataset, change the display of four function renderings to only display Function 1 as an example:
python tools/analysis_tools/dataset_analysis.py configs/yolov5/voc/yolov5_s-v61_fast_1xb64-50e_voc.py \
                                                --func show_bbox_num
6.Use config file configs/yolov5/voc/yolov5_s-v61_fast_1xb64-50e_voc.py analyze the dataset, modify the picture saving address to work_dirs/dataset_analysis:
python tools/analysis_tools/dataset_analysis.py configs/yolov5/voc/yolov5_s-v61_fast_1xb64-50e_voc.py \
                                                --out-dir work_dirs/dataset_analysis